Risk Trends Report
Overview
The Risk Trends Report is essential for tracking and analyzing risk patterns over time. This report helps identify emerging threats, monitor risk fluctuations across different departments or regions, and understand recurring risk factors. It provides valuable insights to enhance risk management strategies and improve decision-making.
To configure a Risk Trends Report, follow these steps:
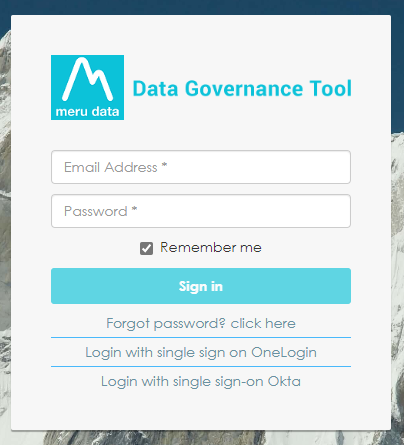
Sign into your Data Governance Tool account.
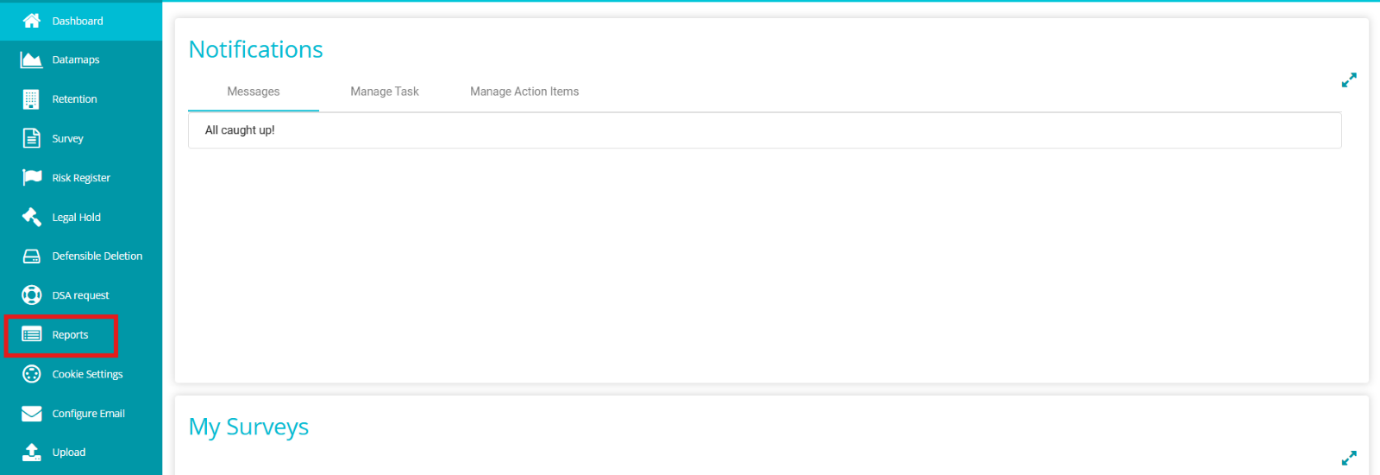
Click on the hamburger
 icon to open the menu.
 Select 'Reports' from the menu.
Click on the
 button on the screen.
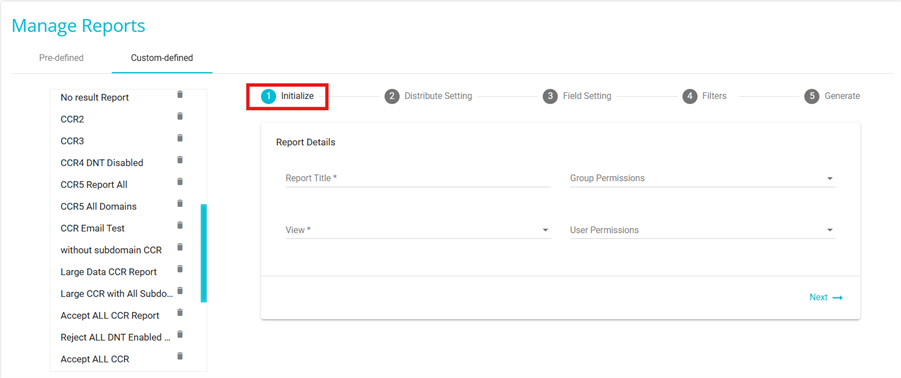
 From the Manage Reports page, click on Custom-Defined.
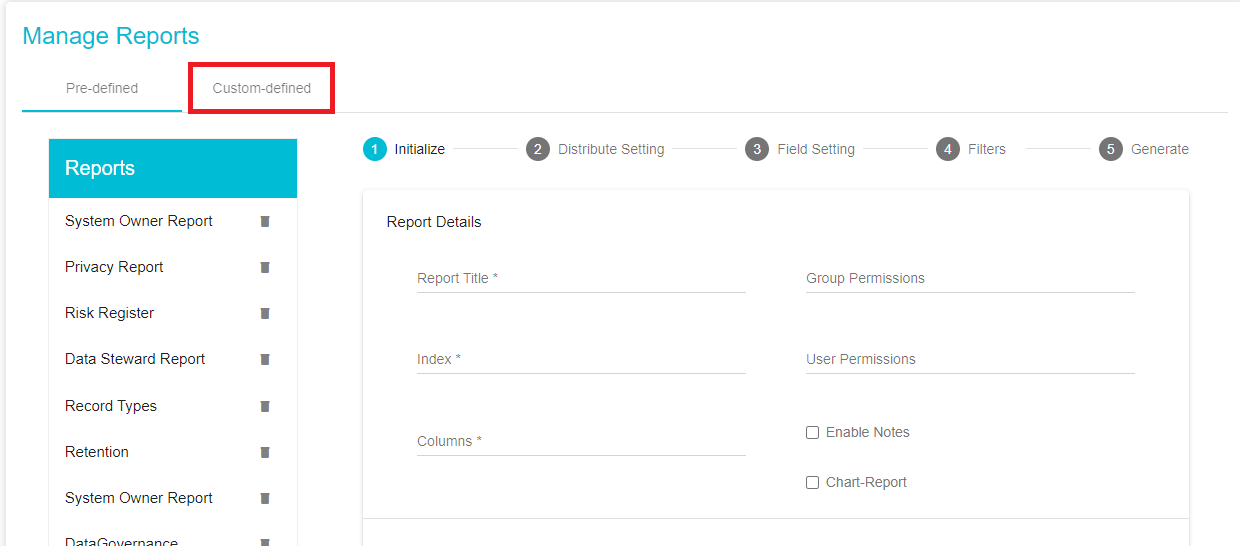
Once on the Custom-Defined tab, under the Initialize section add the report details.
The first section of the Custom Defined Tab is the Initialize Section.
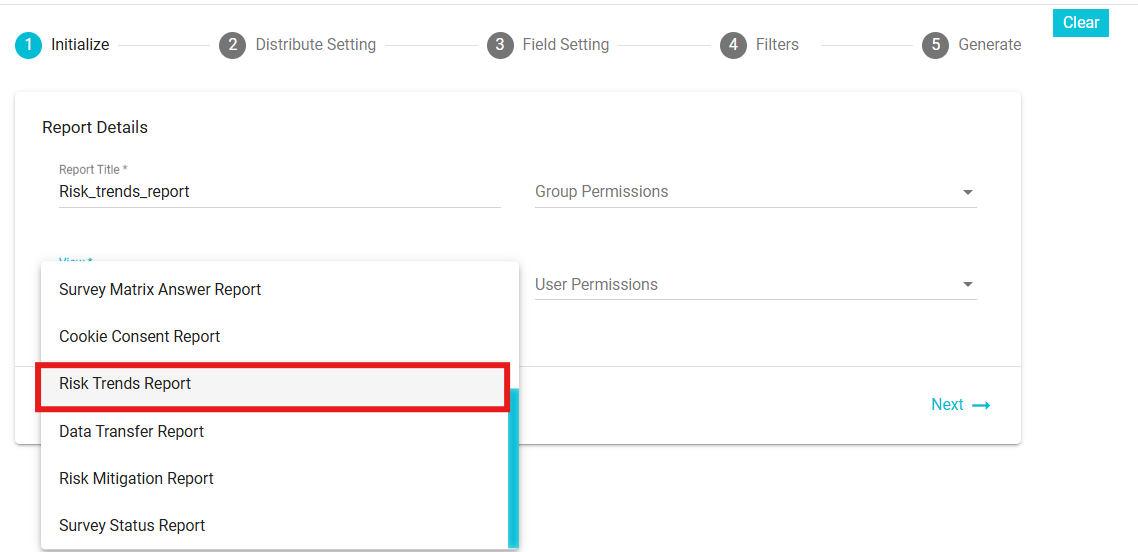
Report Title: add a custom Title to the report.
View: Select "Risk Trends Report " from the drop-down menu .
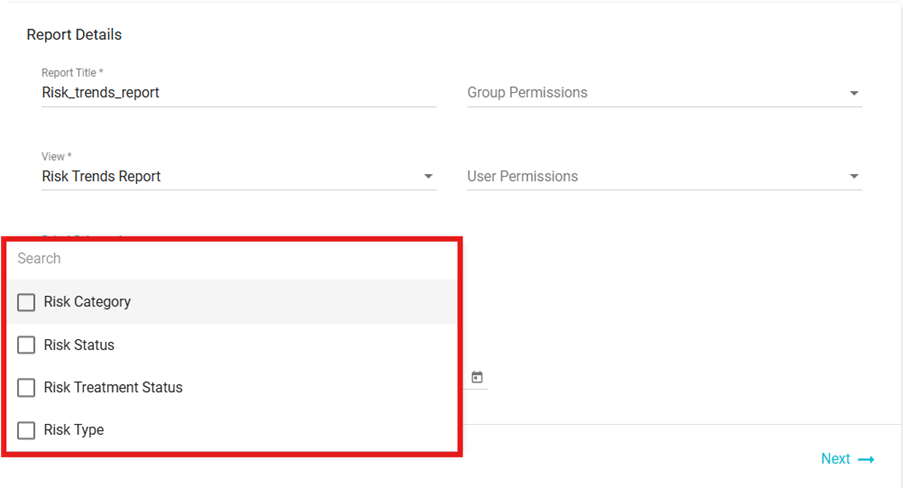
Columns: Once Risk Trends Report has been selected, from the Columns drop-down menu select the columns/fields to be included in the Report. These columns/fields come from the Risk Registers.
Group Permissions: From the drop-down menu, select the groups to which this Report should be made available. The report will be visible in the Reports module for the selected user groups.
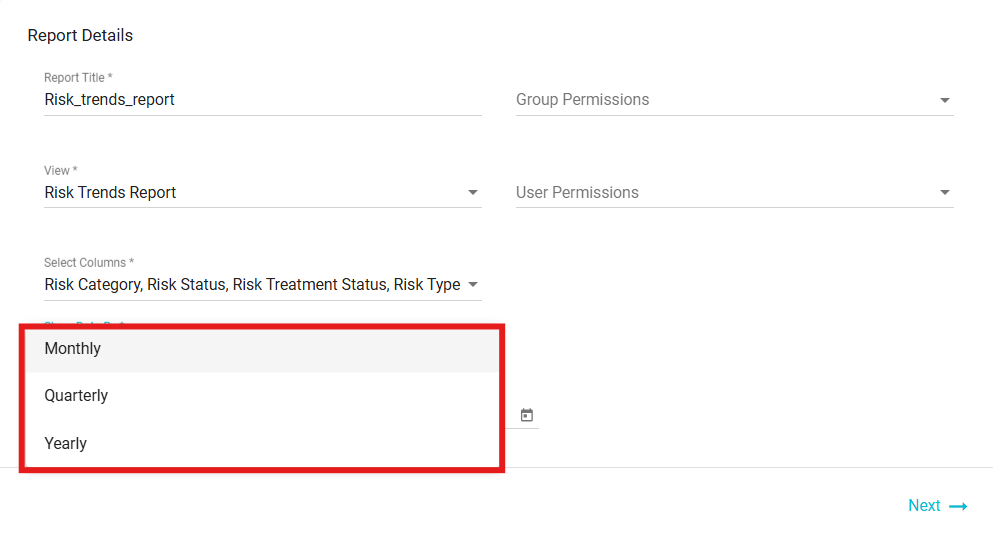
Clicking on "Show Data By" will display three options: Monthly, Quarterly, and Annually.
Monthly: View data for each month to track short-term trends.
Quarterly: Analyze data in three-month intervals for a broader perspective.
Yearly: Get a comprehensive overview of yearly data trends.
User Permissions: If the admin prefers not to expose the report to the entire group, it can be published at the user level. From the drop-down menu, select the users to which this Report should be made available. The report will be visible in the Reports module for the selected users.
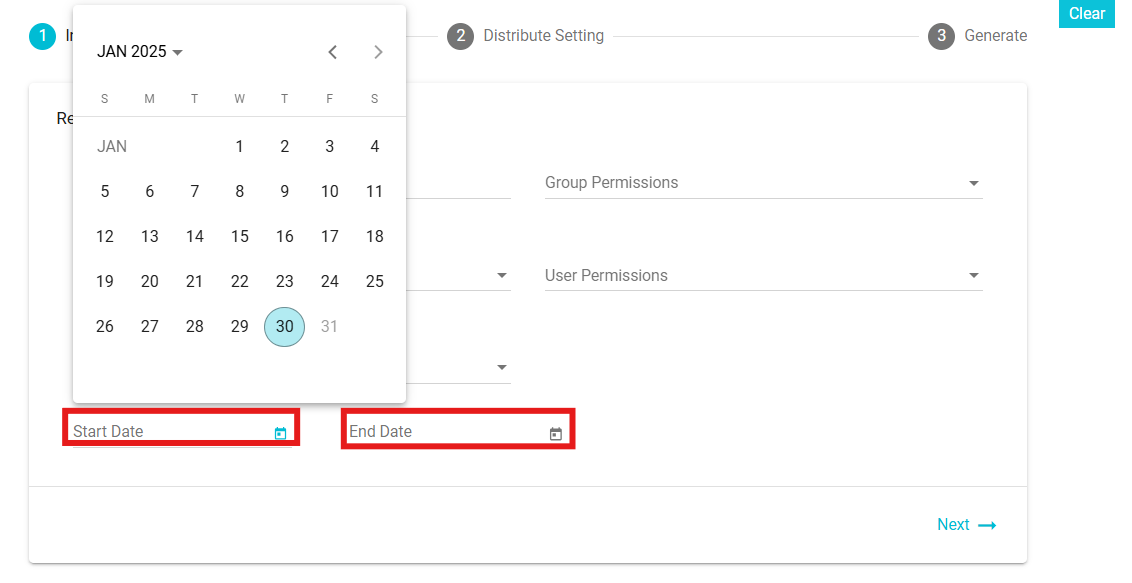
Start date and End date: The start date is when the report begins, and the end date is when it finishes. The report interval defines the time period for which data is displayed, allowing users to view reports on a weekly or monthly basis.
- Next move to the Distribute Settings section
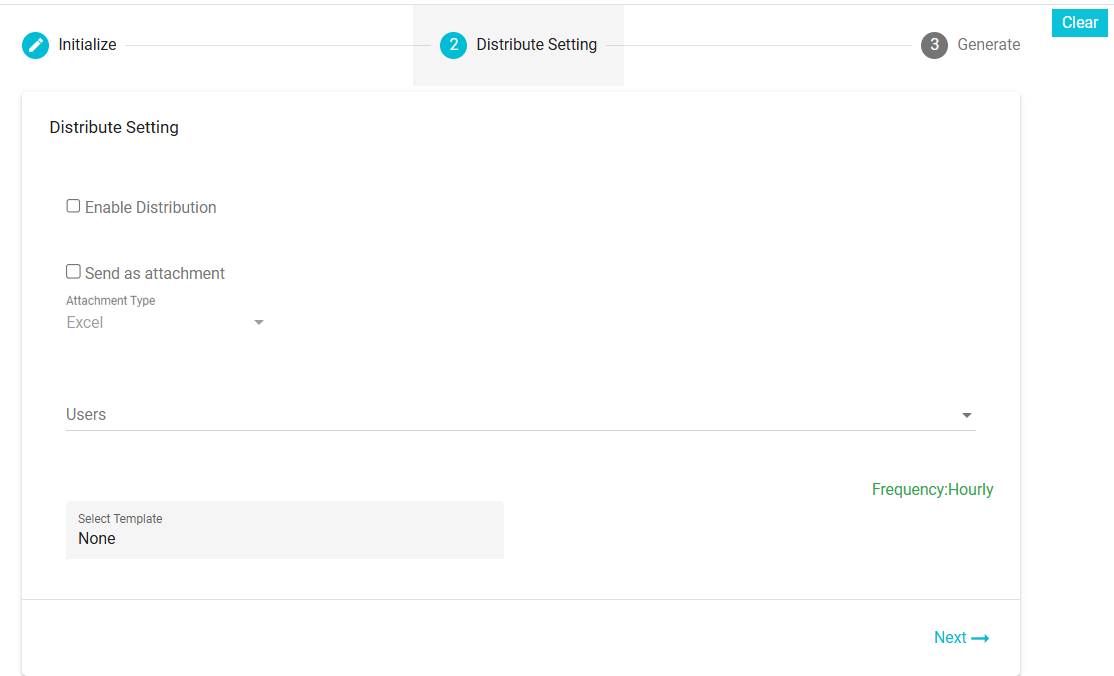
Enable Distribution: Check this box to automate the distribution. The report will be sent automatically to the selected users. The frequency will be determined based on the configured email template(i.e. daily, weekly, monthly or yearly).
Users: Select the users to whom the report should be sent. Users can be either single or multiple.
Send as an Attachment: Enable this checkbox if you want to send the report as an attachment in the email.
Attachment Types: Select the format of the attachment from the available options: Excel.
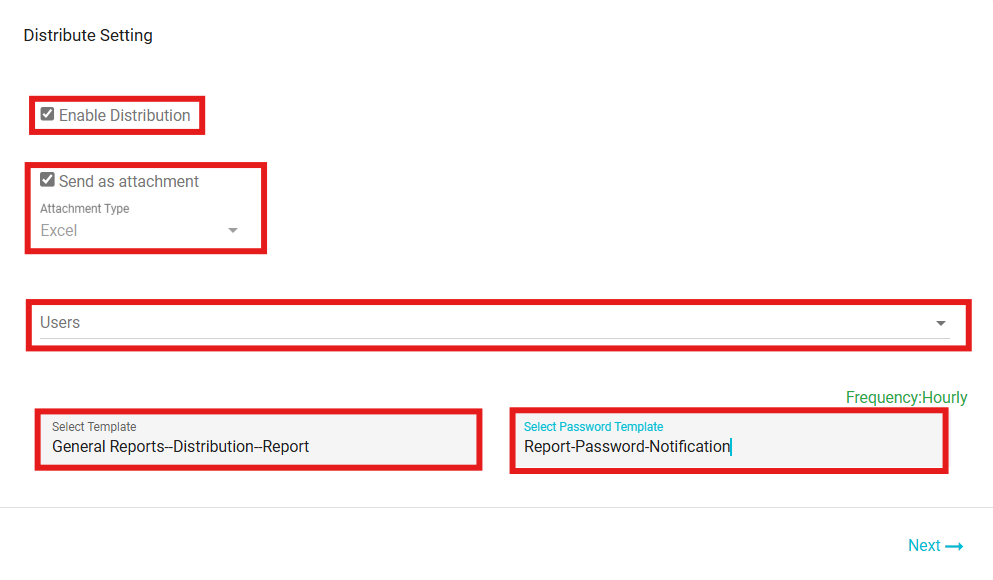
Select Template: Select the email template here. The templates here are defined in the Configure Email module. While configuring the email, the frequency with which it should be sent is also selected and the same is applied here, depending on the template selected. Different templates have different frequencies. To configure an email template for a report, you need to define templates based on specific event types. These event types determine the templates available, which are then displayed on the Distribution screen for selection. For Example: General Reports - Distribution - Report: Used to configure and distribute general reports to selected users or groups .
Select Password Template: Choose the email template for sharing the password required to access the report attachment. For Example: Report - Password - Notification: Sends notifications related to report passwords, ensuring secure access to the distributed reports. If the frequency has not been configured, the frequency field here will not be visible.
Finally move to the Generate Section .
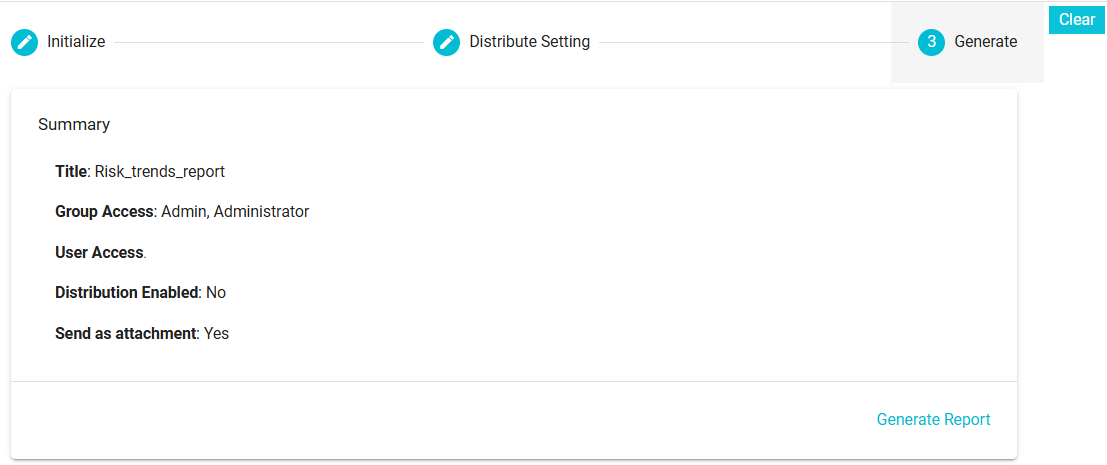
On this section, you can see the summary of the configuration for the report that are about to generate. Changes can be made by going back to the sections of your choice and making the required changes. Finally, on clicking Generate Report, the configuration will be saved, the report will be available in the Reports Module for those users and groups with the permission, and the users selected will receive a copy of the report on their email.
If you decide to discard the configuration for the report, you can click the
 button.
To view the generated risk trends report, follow these steps:
Click on Reports from the hamburger menu.
From the Select report drop-down, click on the report you wish to view.
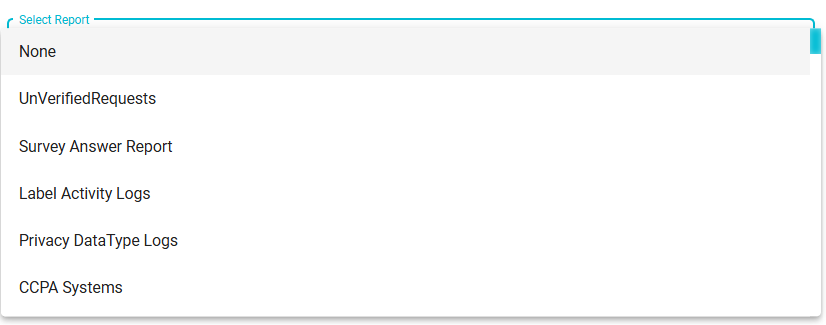
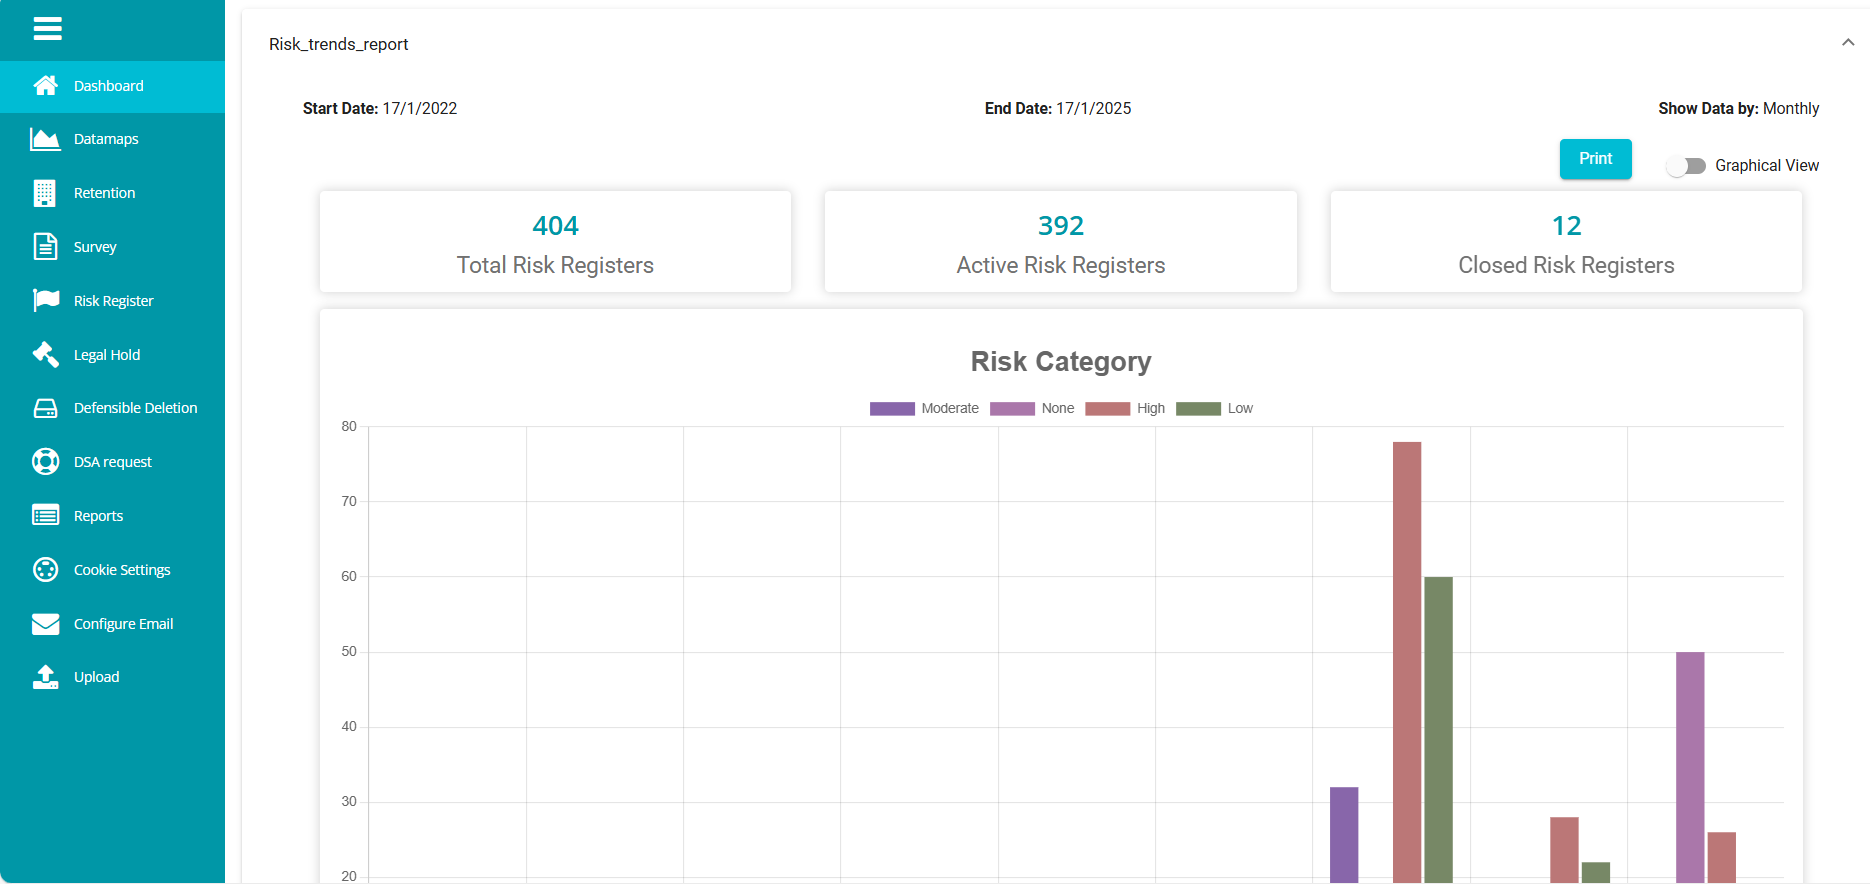
By default, the report is displayed in a graphical view.
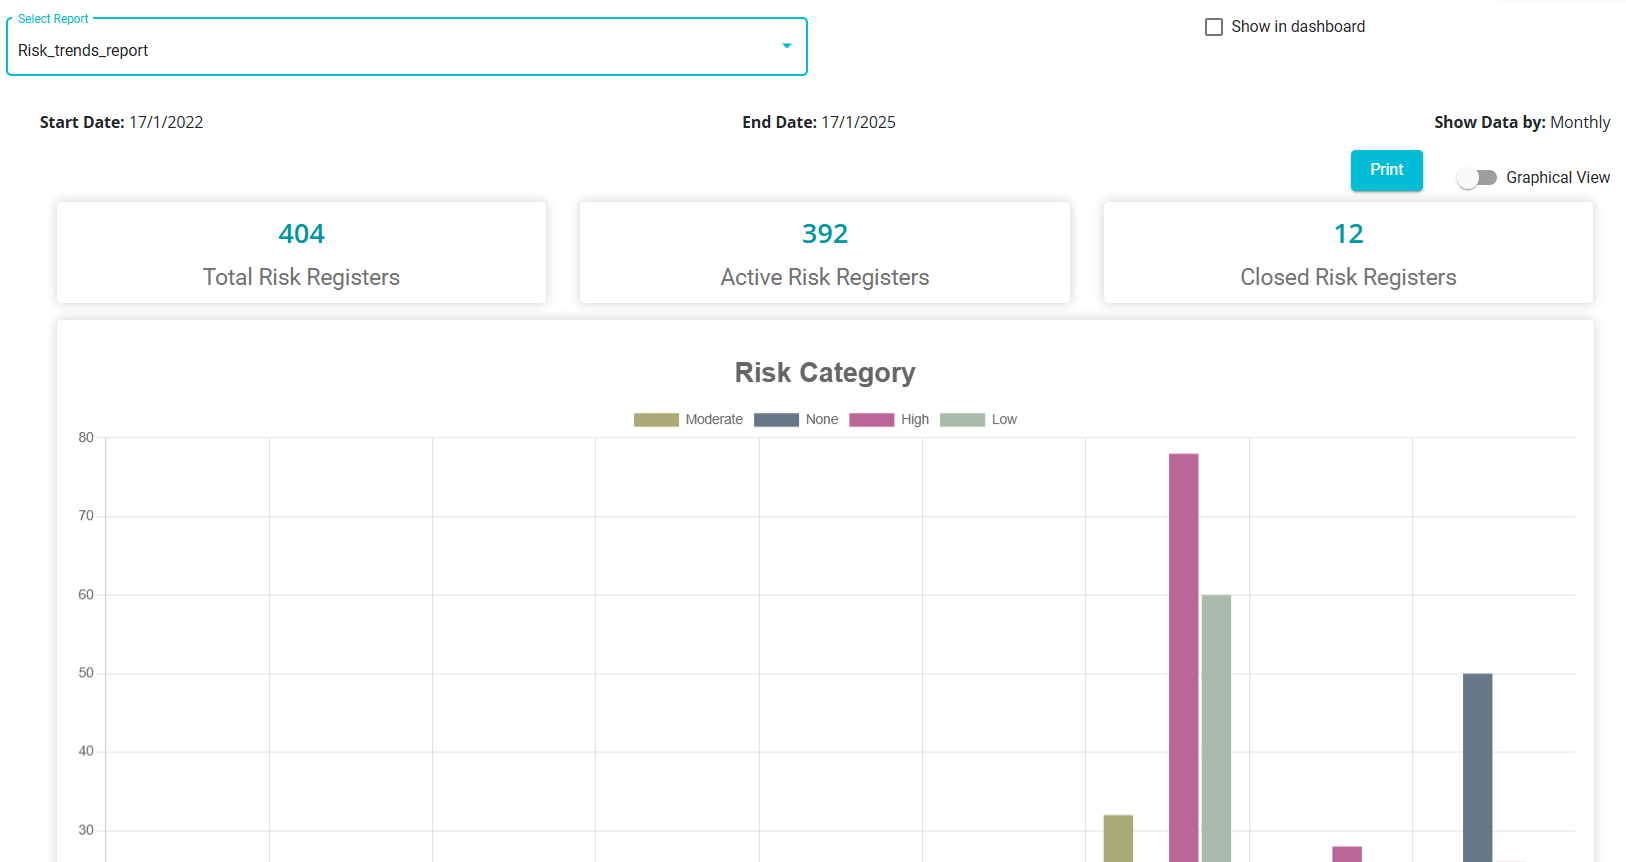
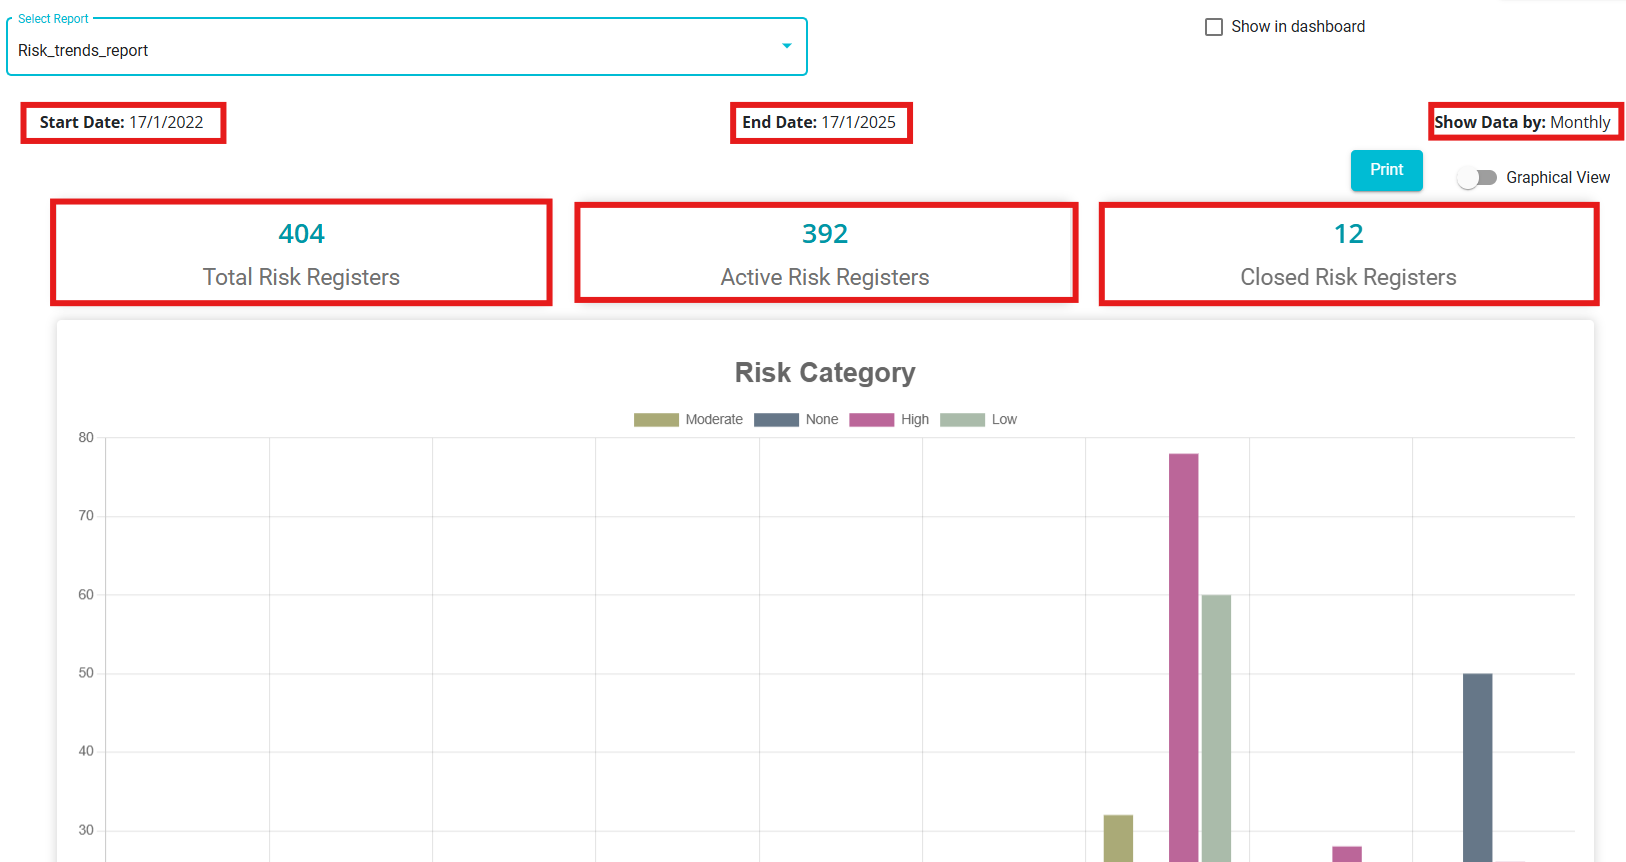
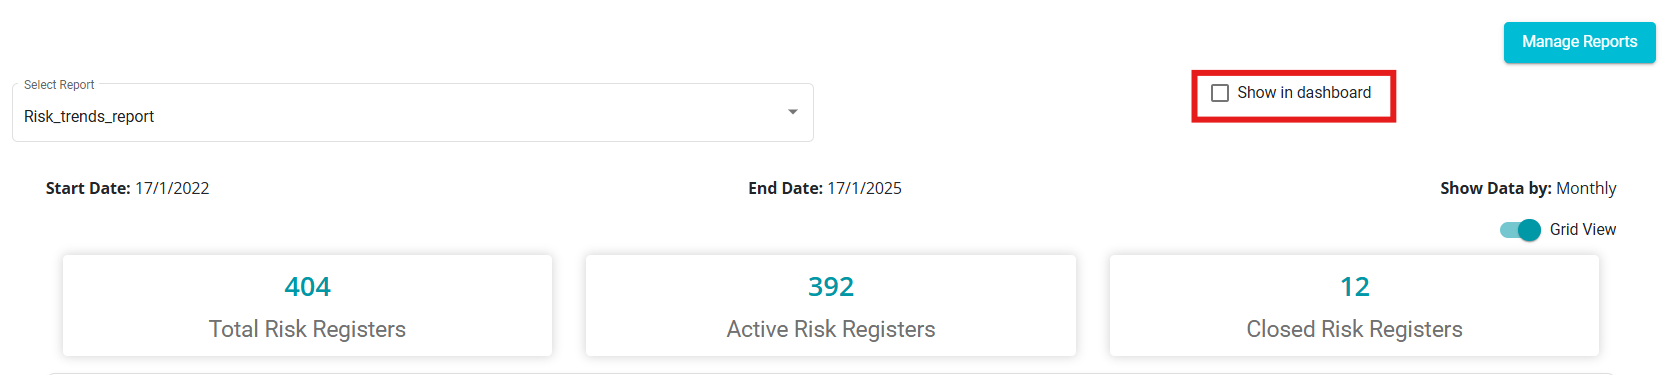
Start Date: Defines the beginning of the data filtering period for analysis.
End Date: Marks the endpoint of the reporting period for data evaluation.
Show Data By: Determines how the data is organized and displayed---monthly, quarterly, or annually.
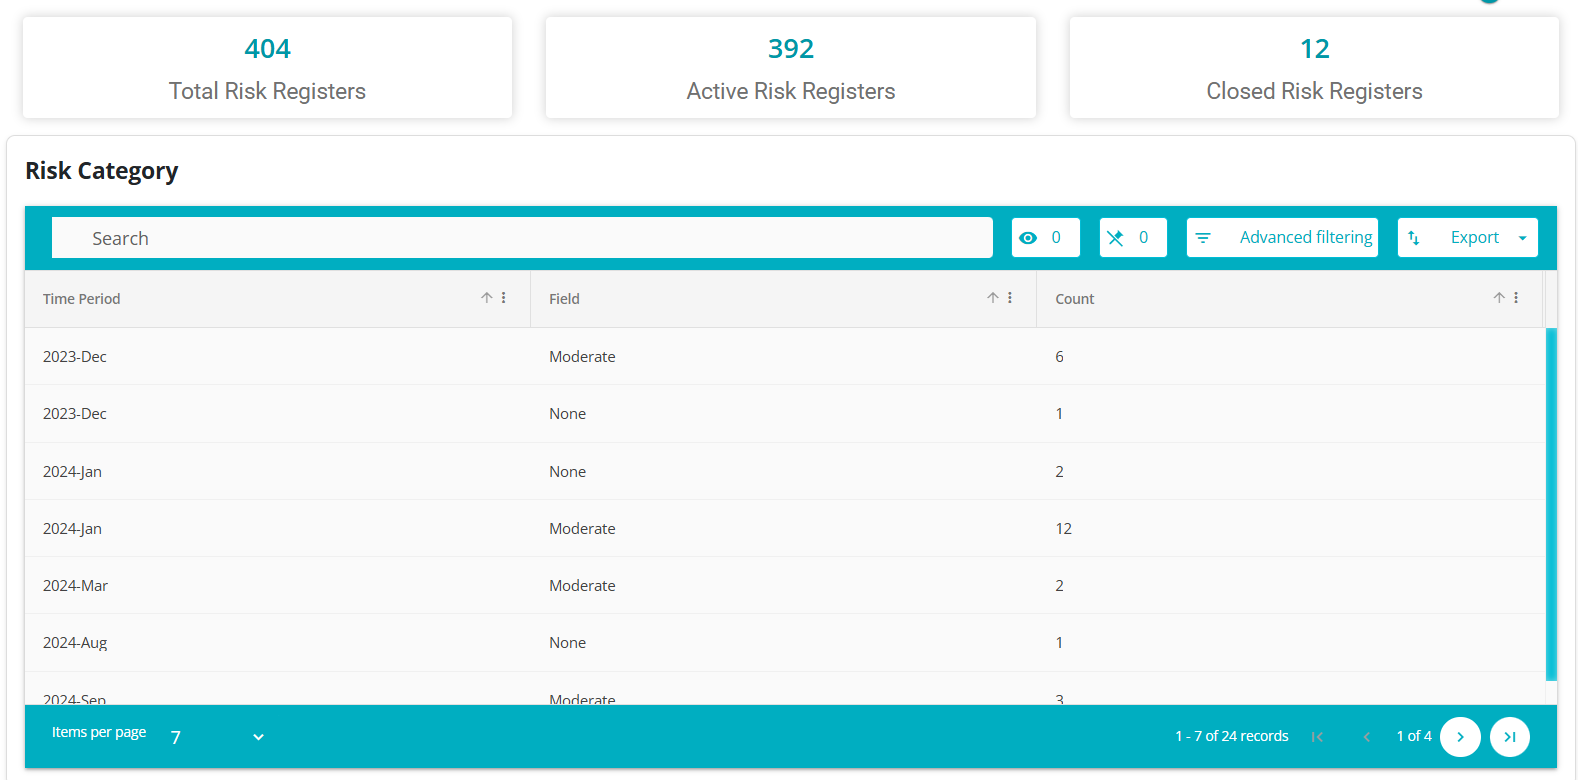
Active Risk Registers: Represents the number of risks that are currently being monitored.
Total Risk Registers: Reflects the complete count of all recorded risks, including active and closed ones.
Closed Risk Registers: Indicates the number of risks that have been successfully resolved or mitigated.
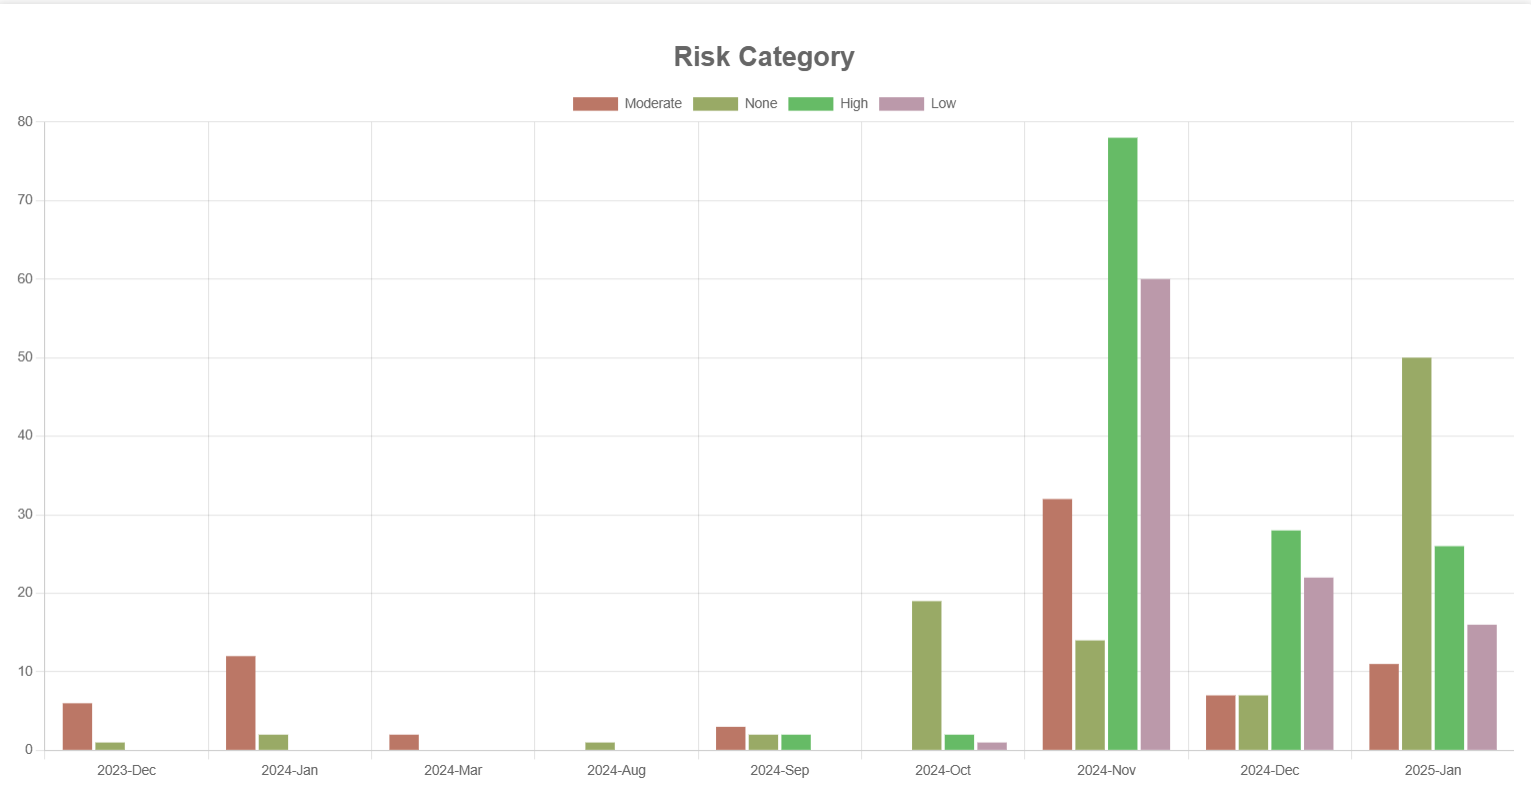
 Based on the selected column while configuring the report, different graphs are generated for each selected value and displayed on the
screen.
Based on the selected column while configuring the report, different graphs are generated for each selected value and displayed on the
screen.Risk Category: Displays the number of risks categorized as Moderate, High, Low, or None in a bar graph format.
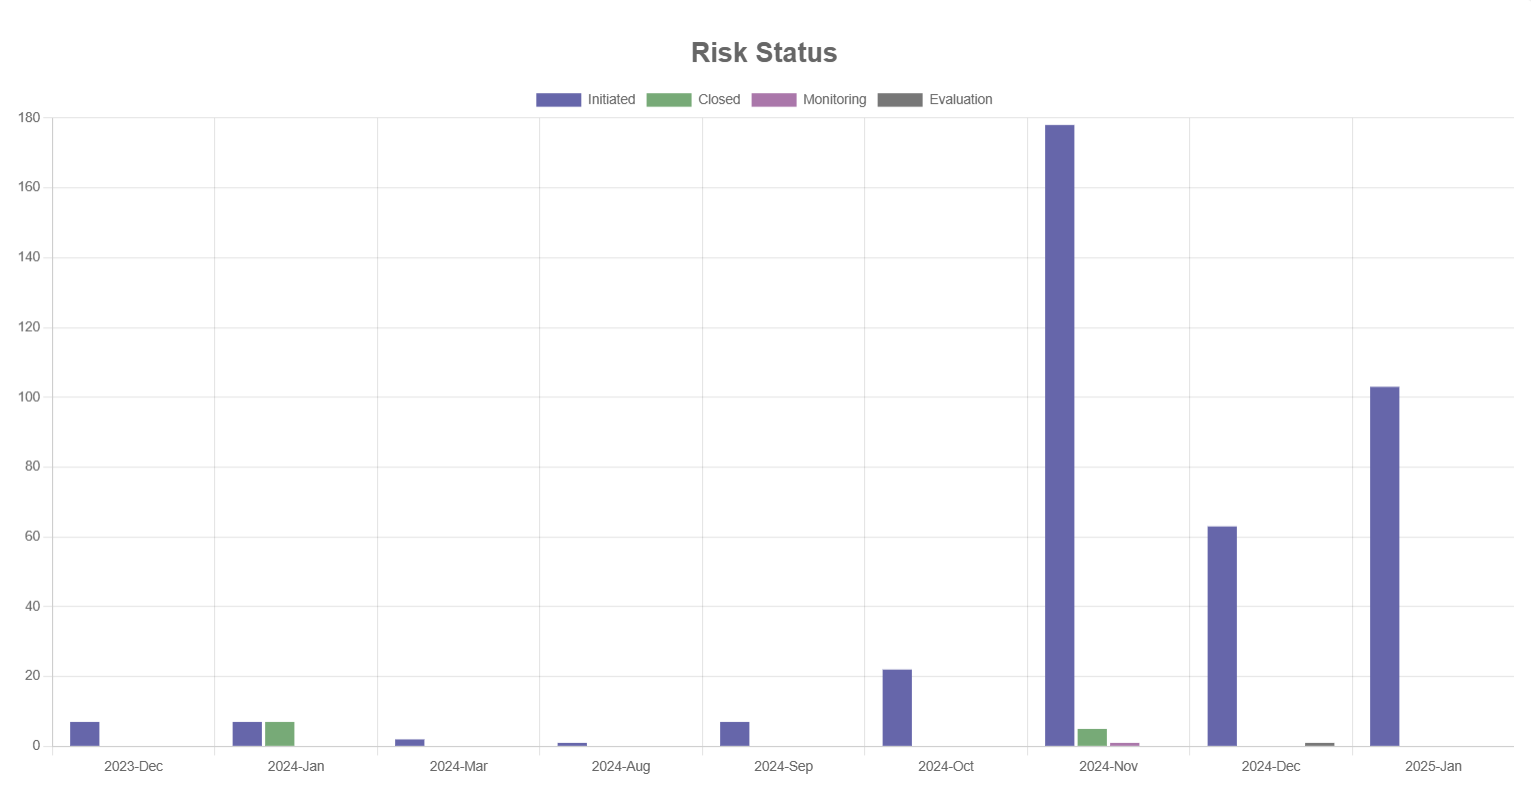
Risk Status: Represents the count of risks under different statuses, such as Initiated, Closed, Monitoring, and Evaluation, using a bar graph.
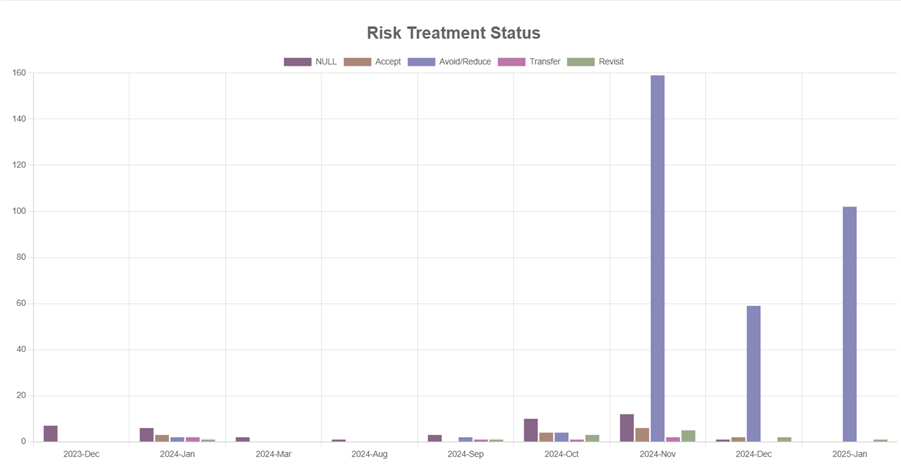
Risk Treatment Status: Shows how risks are being addressed, including Avoid/Reduce, Accept, Null, Transfer, and Revisit, through a bar graph.
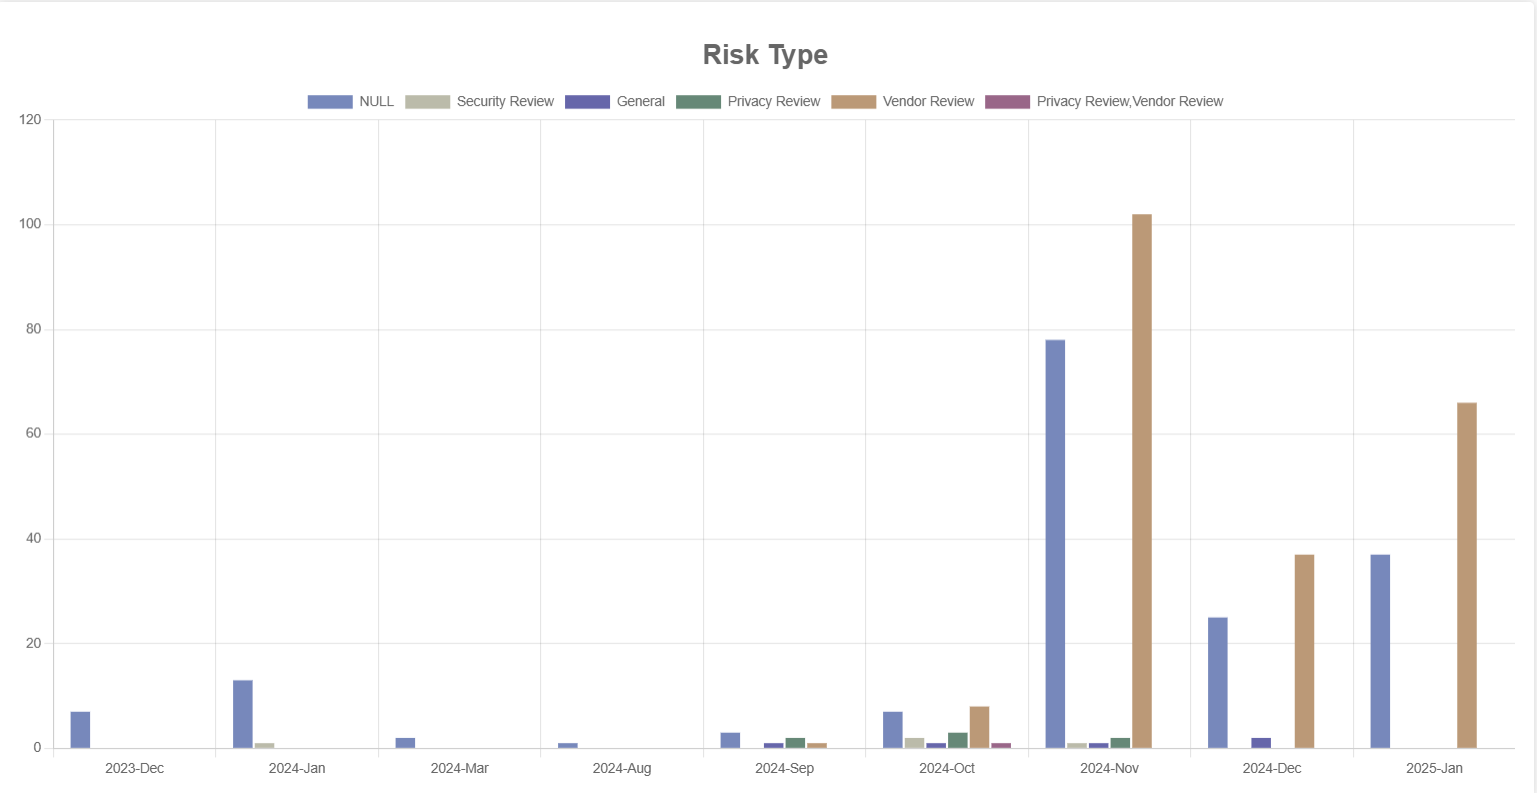
Risk Type: Visualizes the distribution of risk types like Null, Security Review, General, Privacy Review, Vendor Review, and Privacy & Vendor Review in a bar graph.
 Click on the
  button to save the graph as pdf.
Turn on the toggle
 switch to view the report in grid view.
Similarly, different grids are displayed based on the selected column,such as Risk Status, Risk Treatment Status and Risk Type.
The tabular view can be exported in either Excel or CSV format for easy data access and analysis.
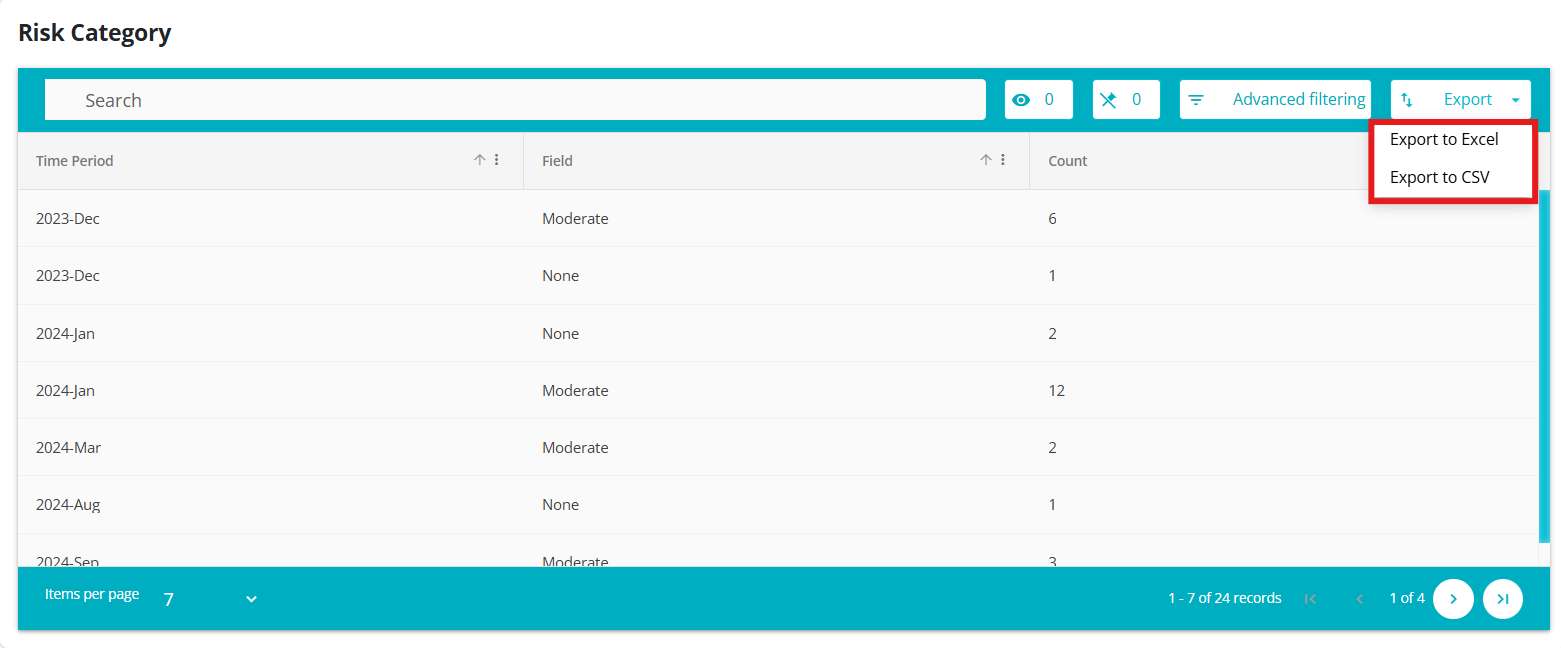
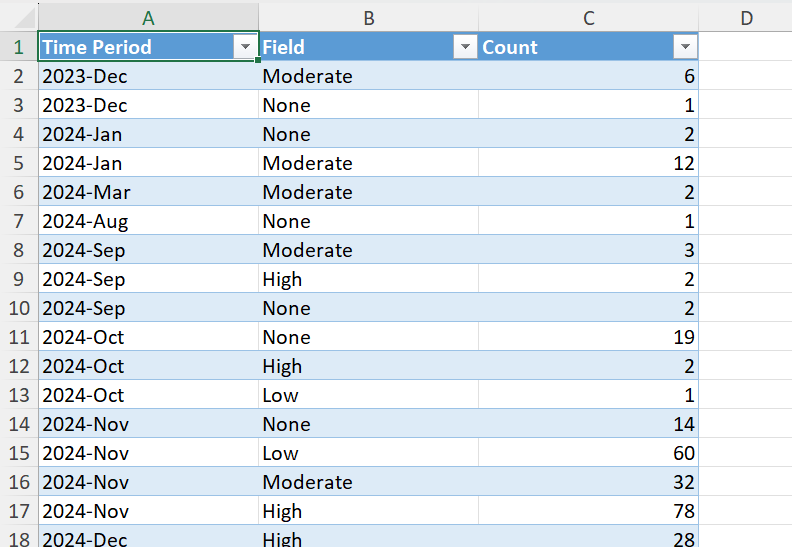
When the tabular format is exported in Excel, it maintains a structured layout.
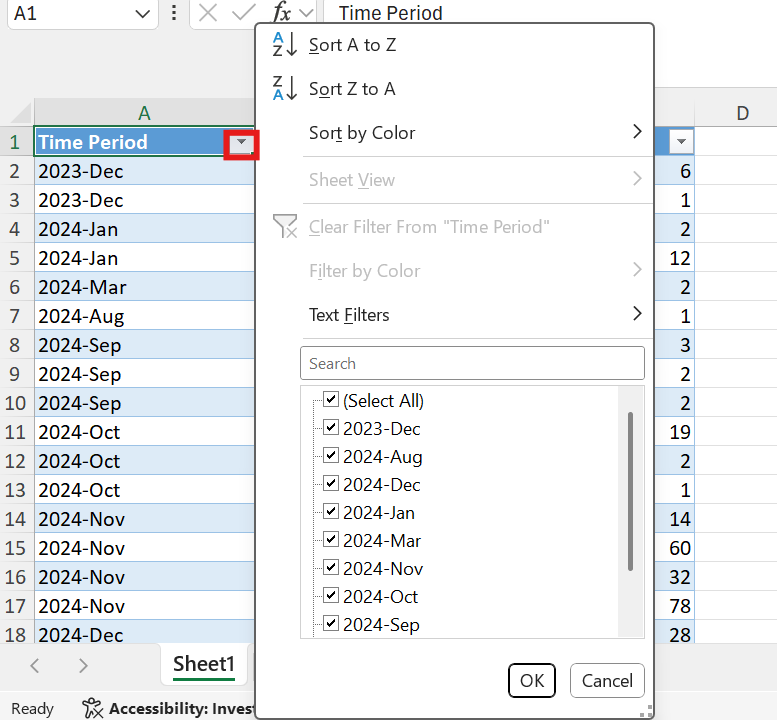
The user can further filter the data based on their requirements by clicking the button next to the field name.
Check the "Show in Dashboard" box to display the report on the main dashboard.
The report appears on the main dashboard.
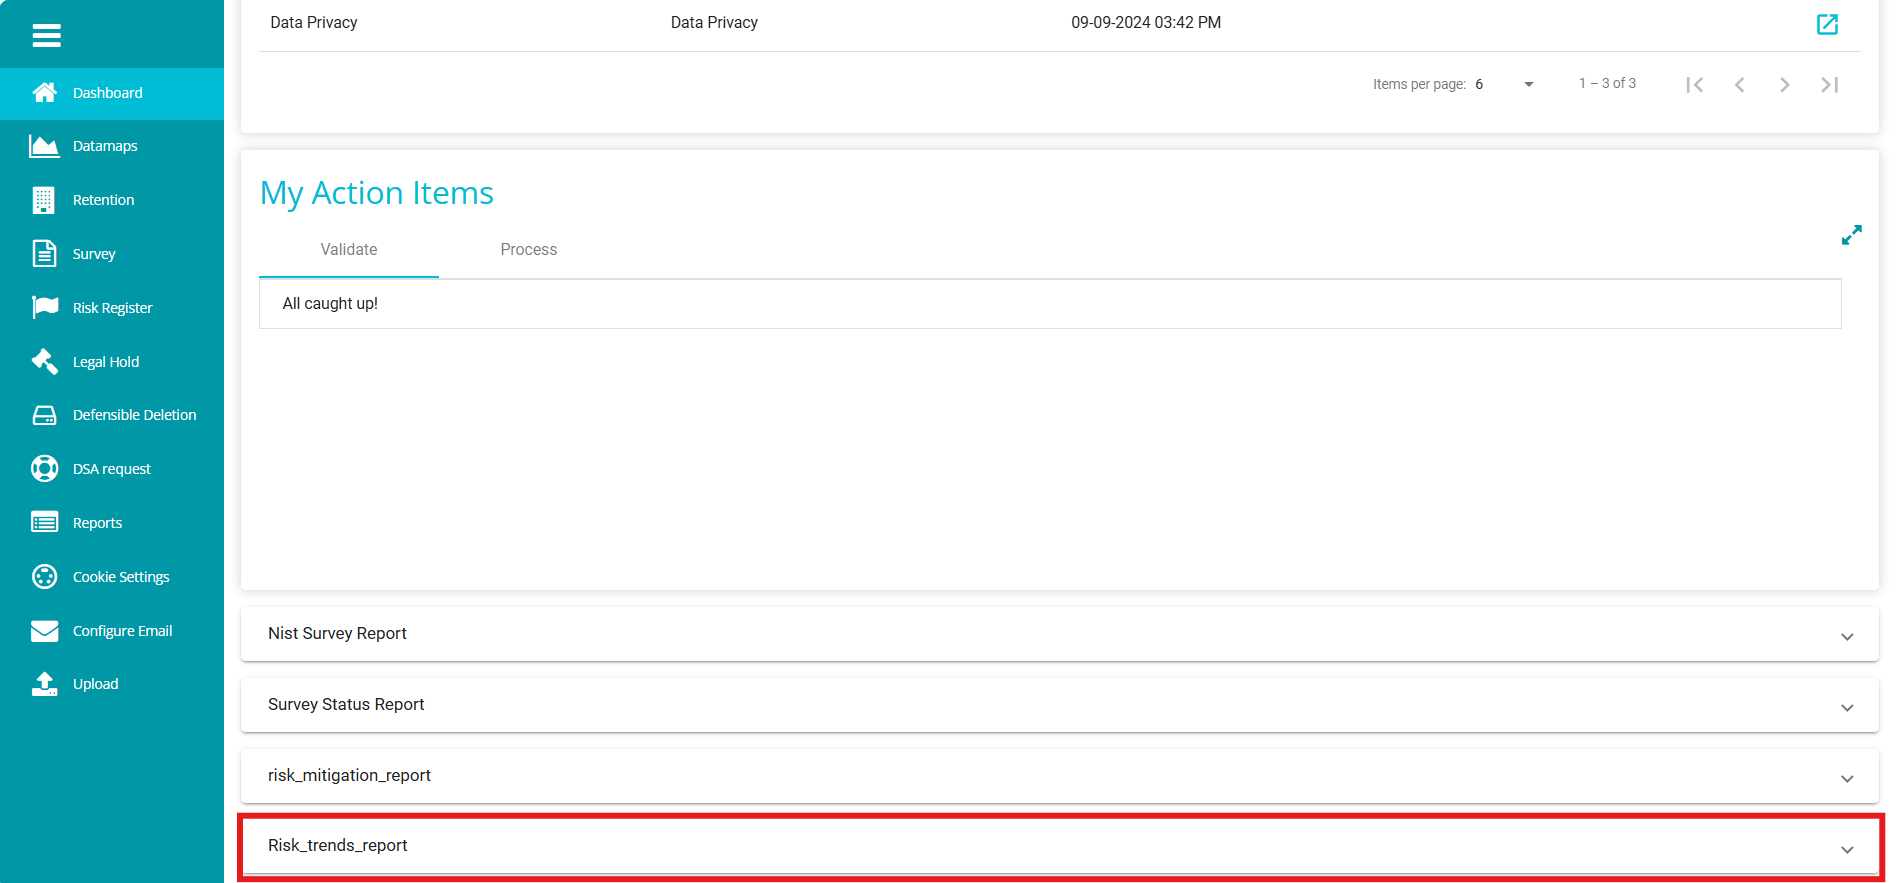
Click on the report to view it directly on the dashboard instead of navigating to the Reports module.